

 Save
Save Print
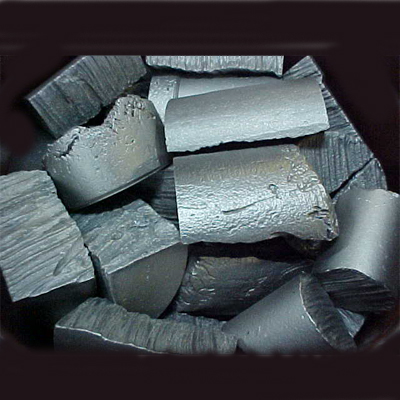
Print【Ferro-alloys.com】:In September 2025, China's total exports of metallic calcium reached 1,848.764 metric tons, a decrease of 340.086 metric tons compared to August, representing a month-on-month decline of 15.5%. From January to September, total exports of metallic calcium amounted to 18,034.276 metric tons, down by 2,865.234 metric tons compared to the same period last year, reflecting a year-on-year decrease of 13.7%.
| Trading partner | Quantity(tons) | US dollar | Total |
| India | 666.025 | 1,825,927 | 36.03% |
| United States | 538.034 | 1,708,805 | 29.10% |
| Netherlands | 83.2 | 282,484 | 4.50% |
| Brazil | 77.1 | 216,295 | 4.17% |
| Spain | 71.4 | 189,869 | 3.86% |
| Slovenia | 68.11 | 181,457 | 3.68% |
| Russia | 67.265 | 138,341 | 3.64% |
| Belgium | 56 | 167,685 | 3.03% |
| Türkiye | 47.775 | 135,268 | 2.58% |
| Georgia | 44.8 | 107,520 | 2.42% |
| Poland | 39.2 | 99,132 | 2.12% |
| Republic of Korea | 32.975 | 89,480 | 1.78% |
| United Arab Emirates | 23.4 | 63,180 | 1.27% |
| Mexico | 17.28 | 56,955 | 0.93% |
| Australia | 11 | 4,270 | 0.59% |
| Viet Nam | 3.2 | 8,480 | 0.17% |
| Egypt | 2 | 1,006 | 0.11% |
| Total | 1848.764 | 5276154 | 100.00% |
| Trading partner | Quantity(tons) | US dollar | Percentage |
| India | 6338.191 | 18,238,939 | 35.15% |
| United States | 3254.84 | 11,134,173 | 18.05% |
| Viet Nam | 1440.552 | 1,824,852 | 7.99% |
| Netherlands | 1210.02 | 3,774,531 | 6.71% |
| Belgium | 1108.188 | 3,346,559 | 6.14% |
| Russia | 864.421 | 2,163,081 | 4.79% |
| Mexico | 573.01 | 1,753,363 | 3.18% |
| United Arab Emirates | 474.59 | 1,415,476 | 2.63% |
| Spain | 471.45 | 1,345,004 | 2.61% |
| Slovenia | 453.3 | 1,380,320 | 2.51% |
| Brazil | 387.1 | 1,080,151 | 2.15% |
| Republic of Korea | 346.394 | 930,729 | 1.92% |
| Türkiye | 305.895 | 867,261 | 1.70% |
| Poland | 293 | 796,585 | 1.62% |
| Japan | 151.565 | 911,744 | 0.84% |
| Georgia | 44.8 | 107,520 | 0.25% |
| Ukraine | 37.8 | 96,089 | 0.21% |
| Bulgaria | 32 | 135,802 | 0.18% |
| Canada | 29.28 | 75,838 | 0.16% |
| Kyrgyzstan | 28 | 85,680 | 0.16% |
| Estonia | 24 | 151,058 | 0.13% |
| Paraguay | 22.4 | 63,728 | 0.12% |
| Romania | 19.6 | 61,870 | 0.11% |
| Australia | 19 | 7,830 | 0.11% |
| Thailand | 17.88 | 56,492 | 0.10% |
| Indonesia | 15.24 | 58,329 | 0.08% |
| Saudi Arabia | 12 | 47,220 | 0.07% |
| Bahrain | 11.2 | 31,453 | 0.06% |
| South Africa | 10.84 | 32,913 | 0.06% |
| Cambodia | 10.2 | 3,292 | 0.06% |
| Belarus | 10 | 31,300 | 0.06% |
| Colombia | 8.4 | 28,398 | 0.05% |
| Taiwan,China | 4.72 | 14,472 | 0.03% |
| Egypt | 2 | 1,006 | 0.01% |
| Venezuela | 1.8 | 6,657 | 0.01% |
| Tanzania | 0.6 | 2,585 | 0.00% |
| Total | 18034.276 | 52062300 | 100.00% |
Copyright © 2013 Ferro-Alloys.Com. All Rights Reserved. Without permission, any unit and individual shall not copy or reprint!
- [Editor:Alakay]
 Daily News
 Research
 Magazine
 Company Database
 Customized Database
 Conferences
 Advertisement
 Trade
Trade


 Online inquiry
 Contact


Tell Us What You Think