

 Save
Save Print
Print[Ferro-Alloys.com] Eramet: Stability in Q1 2025 turnover
- Adjusted turnover of €742m, stable versus Q1 2024, reflecting a negative volume/mix effect (-5%), offset by positive price (+3%) and currency (+3%) effects
- Increase in nickel ore production in Indonesia (+3% vs. Q1 2024); temporary destocking of the plants at the Weda Bay industrial park at the start of the year, weighing on sales (-11%)
- Operational and logistics difficulties encountered since end-2024 at the port of Owendo in Gabon, combined with a social movement in March, leading to a decline in manganese ore volumes sold (-15%)
- Solid operational performance for mineral sands with growth in ilmenite (+68%) and zircon (+32%) volumes sold
- First sales of lithium carbonate produced in Argentina, confirming the operation at industrial scale of the direct extraction process (“DLE”) developed by Eramet
-
Market environment remains very uncertain:
- Decrease in selling prices over Q1, except for manganese ore with a gradual rebound in the price index at around $5.0/dmtu at end-March
- Macroeconomic situation weighing on the Group’s end-markets, particularly the steel industry in China as well as exchange rate trends; to date, the market consensus averaged around $4.7/dmtu in 2025 for manganese ore
-
2025 volume and cash cost targets maintained:
- Transported manganese ore: between 6.7 and 7.2 Mt, with a FOB cash cost between $2.0 and $2.2/dmtu,
- Nickel ore sold externally: 29 Mwmt, in line with the permit delivered
- Lithium carbonate produced: between 10 and 13 kt-LCE, with a gradual ramp-up over the year
- Controlled capex plan in 2025 reiterated: between €400m and €450m
Christel Bories, Eramet group Chair and CEO:
The first quarter turned out to be more difficult than expected, with a highly uncertain market context marked by strong commercial and geopolitical tensions weighing on our markets.
In this disrupted environment, we achieved a mixed operating performance, with sales remaining stable compared with last year.
We continued to ramp up our Centenario plant in Argentina and sold our first tonnes of lithium. This success confirms the efficiency of our direct extraction technology, with a very promising carbonate quality.
Despite this complicated and volatile context, we are maintaining our operating targets for 2025. To achieve them, we must remain focused on the operational performance of each of our sites, cost control, and the rigorous management of our investments and cash.
- Eramet group adjusted turnover by activity
Effective from 2024, the Group’s key performance indicators are presented excluding SLN, since the New Caledonian entity no longer impacts the Group’s financial and economic performance. Reconciliation tables in accordance with IFRS accounts are presented in Appendix 1.
|
Millions of euros1 |
Q1 |
Q1 |
Chg.1 |
Chg.6 |
|
Manganese |
457 |
448 |
9 |
2% |
|
Manganese ore activity2,3 |
250 |
254 |
-4 |
-2% |
|
Manganese alloys activity2 |
207 |
193 |
14 |
7% |
|
Adjusted nickel (excluding SLN)2,4 |
114 |
138 |
-24 |
-18% |
|
Share of PT WBN (38.7% – excluding off-take contract) |
73 |
106 |
-33 |
-31% |
|
Weda Bay (trading activity, off-take contract) |
41 |
32 |
9 |
27% |
|
Mineral Sands |
68 |
52 |
16 |
30% |
|
Lithium |
0 |
0 |
0 |
n.a. |
|
Holding and eliminations |
103 |
105 |
-2 |
-2% |
|
Eramet group adjusted (excluding SLN) |
742 |
743 |
-1 |
0% |
Manganese
The continued operational and logistics difficulties encountered at the port of Owendo at end-2024, combined with a now resolved social movement, did not enable operations under normal conditions in Q1 2025, thereby limiting the volumes of manganese ore sold externally to 1.2 Mt (-15%).
In Q1 2025, turnover of the Manganese activities increased by 2% to €457m:
- Sales for the manganese ore activity were slightly down by 2%, with the decline in volumes sold externally partly offset by an increase in realised selling prices and a favourable currency effect,
- Sales for the manganese alloys activity were up +7%, reflecting a positive price impact.
|
Manganese ore |
Q1 2025 |
Q1 2024 |
Chg. |
Chg. (%) |
|
Turnover – €m |
250 |
254 |
-4 |
-2% |
|
Manganese ore and sinter transportation – Mt |
1.4 |
1.6 |
-0.2 |
-15% |
|
External manganese ore sales – Mt |
1.2 |
1.5 |
-0.3 |
-15% |
|
FOB cash cost (excl. export duties) – $/dmtu2 |
2.4 |
2.2 |
+0.2 |
+7% |
|
Manganese alloys |
Q1 2025 |
Q1 2024 |
Chg. |
Chg. |
|
Turnover – €m |
207 |
193 |
+14 |
+7% |
|
Alloys sales – kt |
149 |
149 |
0 |
0% |
|
o/w refined alloys (%) |
53% |
54% |
-1 pt |
-2% |
Turnover linked to external sales of manganese ore only, including €17m linked to Setrag transport activity other than Comilog's ore (vs. €17m in Q1 2024).
Definition updated (see financial glossary in Appendix ), now excluding mining taxes and royalties (non-controllable), which account for 6% of FOB turnover.
Market trends & prices
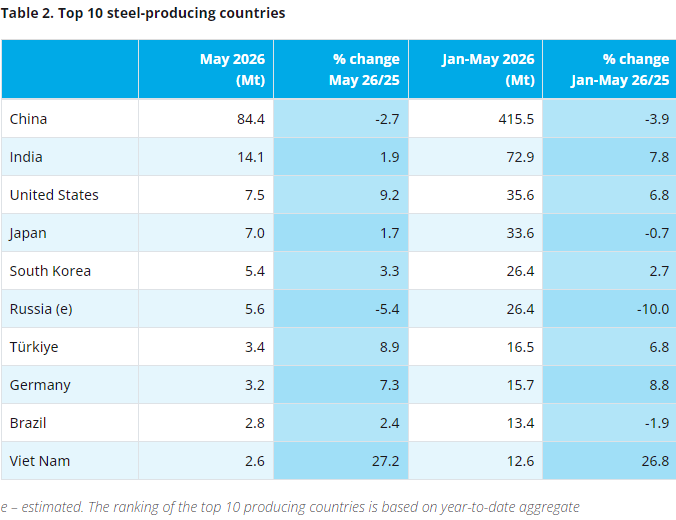
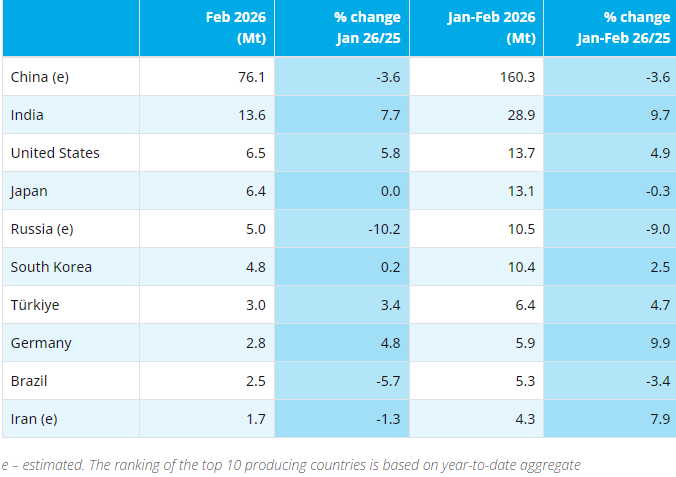
Global production of carbon steel, the main end-product for manganese, was 480 Mt in Q1 2025, stable vs. Q1 2024.
China, which accounts for more than half of global steel production, also posted a slight increase of nearly 1%. Production in North America was almost stable while Europe was down by 1%. India continued to outperform, with an 8% increase in production for Q1 2025.
Manganese ore consumption reached 5.0 Mt in Q1 2025, up 1% (+6% vs. Q4 2024, in line with seasonality), driven by production and replenished manganese alloys inventories, notably in China. Parallel to this, global manganese ore supply was stable at 4.6 Mt. The decrease in volumes from Australia (-80%, impacted by Cyclone Megan at end-March 2024) was partly offset by increased volumes from Gabon (+13%) and South Africa (+3%), which still accounted for nearly 50% of seaborne production in Q1 2025.
As a result, the manganese supply/demand balance was in deficit in Q1 2025 and Chinese port ore inventories strongly decreased, reaching 3.7 Mt at end-March (vs. 5.2 Mt at end-December 2024), equivalent to around 5 weeks of consumption.
The price index (CRU) for manganese ore (CIF China 44%) averaged $4.6/dmtu in Q1 2025, an increase of 8% (+13% vs. Q4 2024), reflecting a supply deficit over the quarter.
The price index (CRU) for refined alloys in Europe (MC Ferromanganese) averaged €1,487/t, up by 5%, reflecting on the one hand, an increase in manganese ore prices and, on the other, the limited regional supply combined with expectations of potential protectionist measures for ferroalloys imported into Europe (in the context of EU Safeguard Measures). The price index for standard alloys (Silicomanganese) returned to the already sustained level of Q1 2024.
Activities
In Gabon, the logistics difficulties in loading encountered at the port of Owendo at end-2024 persisted in Q1 2025, negatively impacting shipments and sales of manganese ore. Coupled with a social movement in March, which is now resolved, this situation did not enable operations under normal conditions, weighing on external sales, down 15% from Q1 2024.
Produced and transported volumes were adjusted to this situation, reaching 1.8 Mt (-7% vs. a record level in Q1 2024) and 1.4 Mt (-15%), respectively.
The FOB cash cost4 for manganese ore activity averaged $2.4/dmtu over the quarter, up 7% from Q1 2024, mainly reflecting the decrease in volumes sold, which was partly offset by a favourable currency effect. Mining taxes and royalties came out to $0.2/dmtu, up from Q1 2024, in connection with the increase in selling prices. Conversely, sea transport costs per tonne were significantly down to $0.7/dmtu (-32%), mainly reflecting the decrease in freight rates versus the high levels in Q1 2024 which was then impacted by the situation in the Red Sea.
Manganese alloys production slightly increased to 162 kt (+5%), due to the restart of production in Dunkirk following refurbishment of the furnace. Manganese alloys sales were stable at 149 kt, with a slightly less favourable mix.
Outlook
Global carbon steel production is expected to remain stable in 2025, with a decrease in Chinese production, offset by an increase for the rest of the world. In particular, India, where Eramet has a strong business footprint, is expected to continue posting a significant increase in its production thanks to new installed capacity, infrastructure investments from the State and continued growth in demand from other steel-consuming sectors. However, this could change considering the trade tensions.
Supply is expected to continue declining in H1, still slightly in deficit versus demand, before increasing again in H2 with the anticipated return to the market of a major Australian producer. Note that manganese ore imports are tax-exempt in the United States.
The market consensus, which is currently set around $4.7/dmtu on average for 20253, could change given the uncertain context.
Demand for manganese alloys should be relatively stable in 2025, as should supply. However, flows could be disrupted by uncertainty surrounding protectionist measures (particularly in Europe and the United States). Alloys selling prices are expected to decline in 2025.
As disclosed at the end of February, transported ore volumes are set to be between 6.7 Mt and 7.2 Mt in 2025. Given the unfavourable trends in the consensus for the €/$ exchange rate, the FOB cash cost4 is now expected to be in the upper range of guidance for 2025 (between $2.0 and $2.2/dmtu).
With respect to alloys, factoring in the restart of the furnace at the Dunkirk plant in early January, production and sales are still expected to increase over the year.
Guidance
The volume and cash cost targets for 2025 are maintained, as presented in the table below.
|
Activities |
Indicator |
2025 guidance |
|
Manganese ore |
Transported volumes |
6.7-7.2 Mt |
|
FOB cash cost |
$2.0-2.2/dmtu |
Quarterly turnover
|
Millions of euros |
Q1 2025 |
Q4 2024 |
Q3 2024 |
Q2 2024 |
Q1 2024 |
|
Manganese |
457 |
460 |
569 |
548 |
448 |
|
Manganese ore activity |
250 |
224 |
338 |
308 |
254 |
|
Manganese alloys activity |
207 |
236 |
231 |
241 |
193 |
Productions and shipments
|
|
Q1 2025 |
Q4 2024 |
Q3 2024 |
Q2 2024 |
Q1 2024 |
|
Manganese ore and sinter production (Mt) |
1,785 |
1,237 |
2,045 |
1,595 |
1,926 |
|
Manganese ore and sinter transportation (Mt) |
1,386 |
1,099 |
1,819 |
1,559 |
1,638 |
|
External manganese ore sales (Mt) |
1,240 |
1,418 |
1,152 |
1,445 |
1,466 |
|
Manganese alloys production (kt) |
162 |
145 |
166 |
170 |
154 |
|
Manganese alloys sales (kt) |
149 |
167 |
143 |
173 |
149 |
Appendix 4: Price and index
|
|
Q1 2025 |
Q4 2024 |
Q1 2024 |
Chg. Q1 2025 – Q1 2024 |
Chg. Q1 2025 – Q4 2024 |
|
Mn CIF China 44% ($/dmtu)1 |
4.64 |
4.08 |
4.29 |
+8% |
+14% |
|
Ferromanganese MC – Europe (€/t)1 |
1,487 |
1,499 |
1,419 |
+5% |
-1% |
|
Silicomanganese – Europe (€/t)1 |
1,087 |
1,000 |
1,097 |
-1% |
+9% |
Invitation forThe 21st China Ferro-Alloys International Conference

- [Editor:tianyawei]
 Daily News
 Research
 Magazine
 Company Database
 Customized Database
 Conferences
 Advertisement
 Trade
Trade


.jpg)
 Online inquiry
 Contact


Tell Us What You Think