

 Save
Save Print
Print[Ferro-Alloys.com] Eramet: Turnover down in third quarter 2025
- Safety results in line with the Group’s CSR roadmap
-
Adjusted turnover1 of €720m, down 10% versus Q3 2024:
- Positive volume effect (+22%), notably for manganese ore (+8%) and nickel ore (6.7x) sales, with significantly lower comparatives in Q3 2024
- Negative price effect (-25%), combined with an unfavourable currency effect (-6%)
- Logistics challenges in the transportation of manganese ore (-13% in volumes)
- Robust ramp-up in lithium carbonate production, in line with target
-
Still highly uncertain macroeconomic environment weighing on demand and selling prices, and penalising the Group’s cash generation which remained negative over the period
-
Improvement programme addressing the Group’s short term and medium term operational and financial performance around initiatives started in Q3, based on three main pillars:
- Safety and positive mining
- Operational excellence and productivity
- Financial resilience
- Revision of 2025 targets for manganese ore activity:
-
Transported manganese ore: revised between 6.1 and 6.3 Mt (vs. 6.5 and 7.0 Mt disclosed at end-July), as well as the FOB cash cost2 which is now expected between $2.3 and $2.4/dmtu3 (vs. $2.1 and $2.3/dmtu)
- Nickel ore sold externally: confirmed between 36 and 39 Mwmt
- Lithium carbonate produced: confirmed between 4 and 7 kt-LCE
-
Improvement programme addressing the Group’s short term and medium term operational and financial performance around initiatives started in Q3, based on three main pillars:
- Reduced Capex plan in 20254: between €400m and €425m (vs. €400m and €450m disclosed previously)
Paulo Castellari, Group CEO:
Despite a challenging market environment, Eramet has maintained a solid level of activity, thanks to the commitment and agility of its teams.
To assess our strengths and the challenges we face, we carried out a Group-wide performance review, which provides a clear view of where we stand and where we can improve.
We have already initiated decisive actions to strengthen our cash generation, enhance financial resilience, and simplify our processes.
Ensuring the safety of our employees and subcontractors, materially improving the operational and financial performance as well as restoring the balance sheet, are the top priorities for the Group. We will accelerate these efforts in the months ahead to build a stronger and more competitive Eramet.
- Eramet operational and financial performance improvement programme
At end-June, the Group launched an in-depth operational review of all its assets (“Eramet Performance Review”), with the objective of boosting performance, in compliance with safety standards, and of creating value.
The findings of this review now enable the new management team to work on the development of a programme to boost Eramet’s performance on a site-by-site basis and to strengthen cash generation and the balance sheet, with enhanced discipline in cost control and capital allocation. This programme will incorporate initiatives already launched in Q3, the first effects of which are expected by year-end. It is structured around three main pillars:
-
Safety and positive mining:
- Reducing injuries and High Potential Incidents (“HPIs”),
- Improving risk management processes as well as reliability and sustainability of production systems and logistics.
- Operational excellence and productivity:
- Debottlenecking and targeted investments across rail and port,
- Reducing operating costs including initial measures to lower general and administrative expenses, and non-essential spend, as well as optimising procurement costs.
- Launch of a “cash boost programme” in Q2, including working capital optimisation,
- Optimising maintenance capex to ensure de-bottlenecking and reduce instances of production failure, reducing growth capex, including the deferral of non-essential and non-committed investments,
- Ensuring strict discipline in cost control and capital allocation, with measures to enhance discipline and accountability in performance management processes.
- Financial resilience, with a focus on cash preservation and platform towards sustained cash flow generation:
Further information will be provided to the market early December.
This programme lays the foundation to build a stronger and more competitive Eramet and will be expanded to a broader set of initiatives. In addition, the Group is considering further measures to maintain adequate level of liquidity and restore its balance sheet.
To mitigate the risk of not complying with its gearing covenant as of 31 December 2025, the Group requested a waiver from its lenders.
- Eramet group adjusted turnover by activity
The Group’s key performance indicators are presented excluding SLN, since the New Caledonian entity no longer impacts the Group’s financial and economic performance. Reconciliation tables in accordance with IFRS accounts are presented in Appendix 1.
|
Millions of euros1 |
Q3 |
Q3 |
Chg.1 |
Chg.6 |
9m 2025 |
9m 2024 |
Chg.1 |
Chg.6 |
|
Manganese |
421 |
569 |
-148 |
-26% |
1,369 |
1,565 |
-196 |
-13% |
|
Manganese ore activity2,3 |
221 |
338 |
-117 |
-35% |
745 |
900 |
-155 |
-17% |
|
Manganese alloys activity2 |
200 |
231 |
-31 |
-14% |
624 |
665 |
-41 |
-6% |
|
Adjusted nickel (excluding SLN)2,4 |
142 |
64 |
+78 |
+122% |
373 |
349 |
+24 |
+7% |
|
Share of PT WBN (38.7% – excluding off-take contract) |
88 |
25 |
+63 |
+252% |
244 |
247 |
-3 |
-1% |
|
Weda Bay (trading activity, off-take contract) |
54 |
39 |
+15 |
+39% |
129 |
102 |
+27 |
+27% |
|
Mineral Sands |
51 |
75 |
-24 |
-32% |
186 |
216 |
-30 |
-14% |
|
Lithium |
7 |
0 |
+7 |
n.a. |
11 |
0 |
+11 |
n.a. |
|
Holding and eliminations5 |
98 |
96 |
+2 |
+2% |
308 |
313 |
-4 |
-1% |
|
Eramet group adjusted (excluding SLN)2,4 |
720 |
804 |
-84 |
-10% |
2,248 |
2,443 |
-195 |
-8% |
1 Data rounded to the nearest million.
2 See definition in Appendix 7.
3 Turnover linked to external sales of manganese ore only, including €18m in Q3 2025 linked to Setrag transport activity other than Comilog’s ore (stable vs. Q3 2024).
4 Adjusted turnover restated for Q3 2024 and 9m 2024, following update of indicator definition.
5 Mainly includes turnover from the sale of SLN’s ferronickel since it is booked under “Eramet S.A.”; SLN’s turnover linked to the sale of nickel ore and others was excluded from the figures presented.
6 Data rounded to higher or lower %.
Manganese
In Gabon, manganese ore transportation declined over the quarter, due to operational challenges on the rail network. As a result, transported manganese ore volumes totalled 1.6 Mt (-13% vs. Q3 2024).
In Q3 2025, turnover for Manganese activities declined to €421m (-26%):
- Revenue for the manganese ore activity was down 35%, penalised by the decrease in realised selling prices (-40%) and an unfavourable currency effect, which was partly offset by an increase in volumes sold externally (versus favourable comparatives),
- Revenue for the manganese alloys activity declined by 13%, reflecting an unfavourable price and mix effect.
|
Manganese ore |
Q3 2025 |
Q3 2024 |
Chg. |
9m 2025 |
9m 2024 |
Chg. |
|
(%) |
(%) |
|||||
|
Turnover - €m1 |
221 |
338 |
-35% |
745 |
900 |
-17% |
|
Manganese ore and sinter transportation - Mt |
1,586 |
1,819 |
-13% |
4,631 |
5,016 |
-8% |
|
External manganese ore sales - Mt |
1,245 |
1,152 |
+8% |
3,917 |
4,063 |
-4% |
|
FOB cash cost (excl. export duties) - $/dmtu2 |
2.3 |
2.1 |
+14% |
2.3 |
2.1 |
+12% |
|
Manganese alloys |
Q3 2025 |
Q3 2024 |
Chg. |
9m 2025 |
9m 2024 |
Chg. |
|
(%) |
(%) |
|||||
|
Turnover - €m |
200 |
231 |
-13% |
624 |
665 |
-6% |
|
Alloys sales - kt |
156 |
143 |
+9% |
465 |
465 |
+0% |
|
o/w refined alloys (%) |
54% |
58% |
-4 pts |
51% |
55% |
-4 pts |
1 Turnover linked to external sales of manganese ore only, including €18m linked to Setrag transport activity other than Comilog's ore (stable vs. Q3 2024).
2 Definition updated (see financial glossary in Appendix 7), now excluding mining taxes and royalties (non-controllable), which account for 6% of FOB turnover.
Market trends9 & prices10
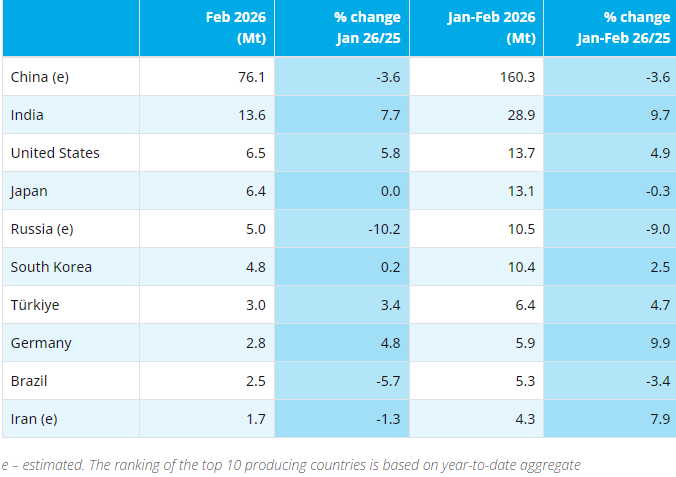
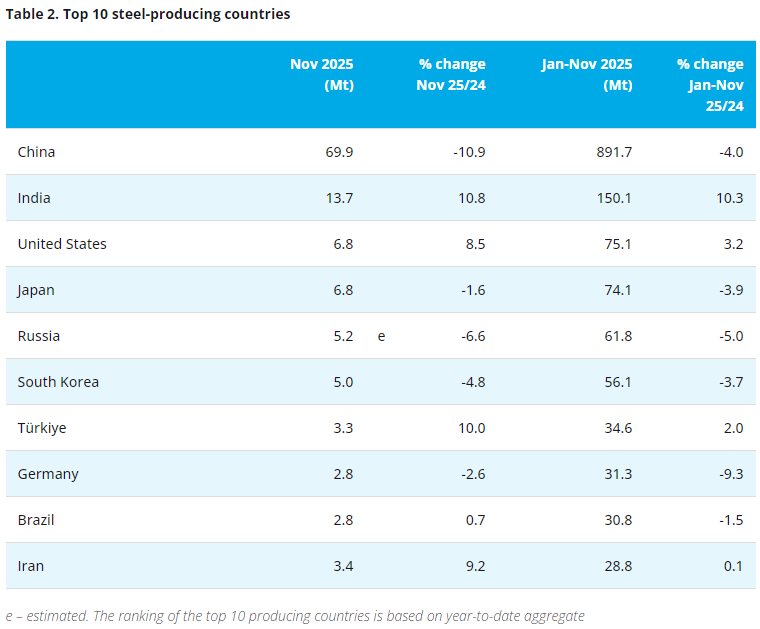
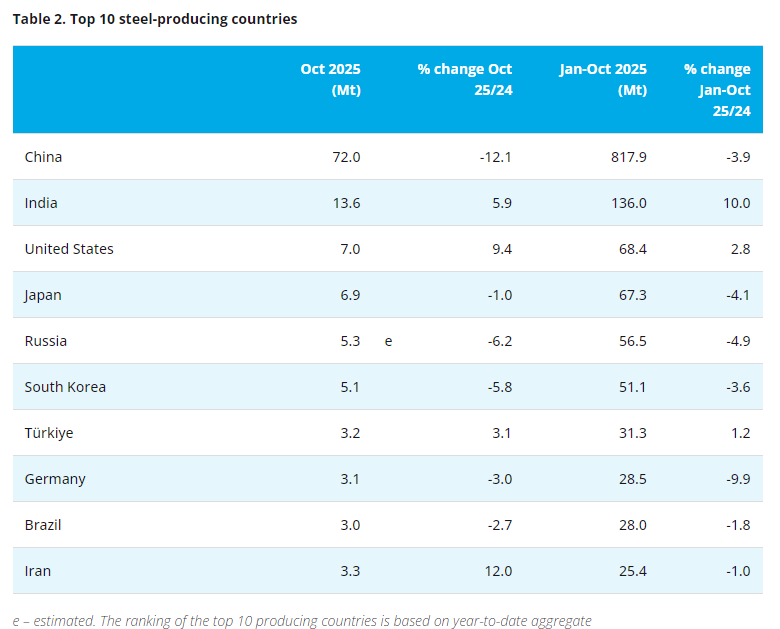
Global production of carbon steel, the main end-product for manganese, was 454 Mt in Q3 2025, relatively stable vs. Q3 2024 (-1% over nine months).
Chinese production, which still accounts for more than half of global steel production, was stable compared to a particularly low Q3 2024 performance. India continued to grow production (+12%). Production in North America was also up (+4%), influenced by the introduced trade measures. Conversely, Europe posted a decline of 6%, faced with steadily declining demand and sustained pressure from imports.
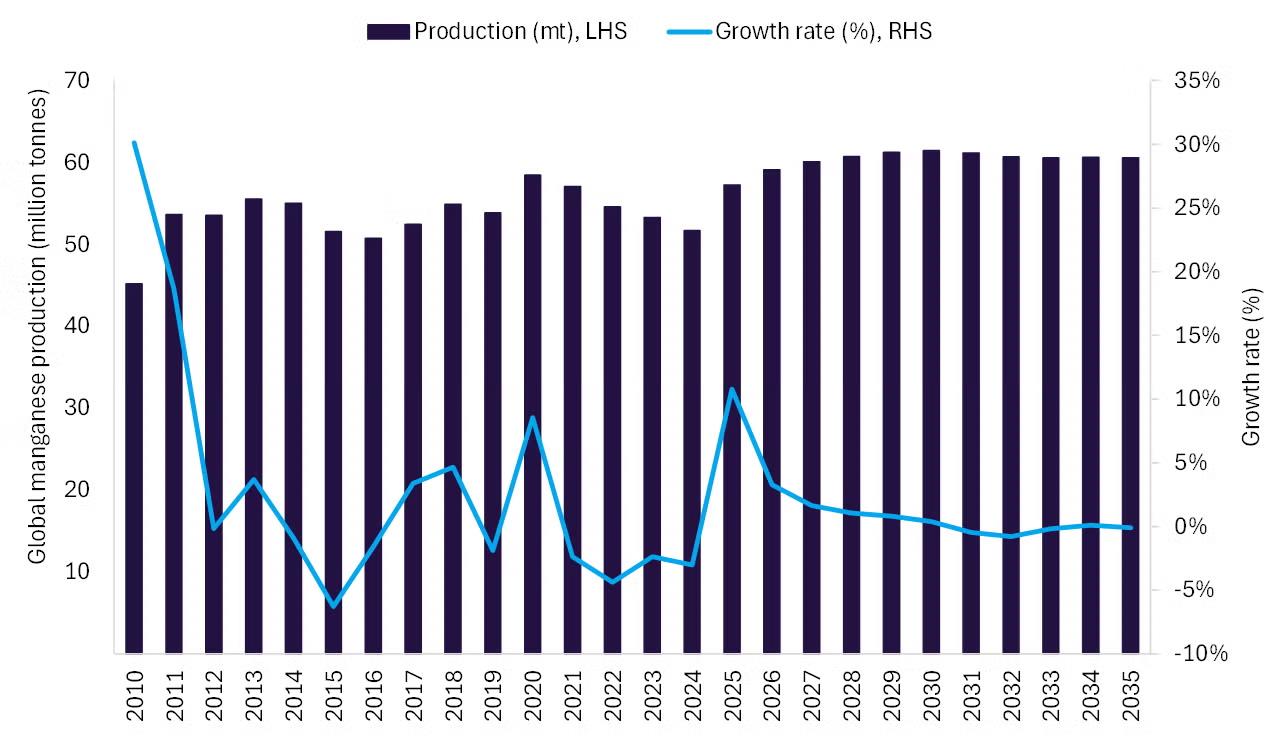
Manganese ore consumption reached 5.2 Mt-Mn globally in Q3 2025, up 8% (+7% over nine months), driven by sustained manganese alloys production, particularly in China. This has led to an increase in manganese alloy inventories among Chinese producers since the beginning of the year, in a local context of flat to slightly declining steel production.
Manganese ore production amounted to 5.3 Mt-Mn globally in Q3 2025, down 1% (-4% over nine months). Production from South Africa (still accounting for nearly 50% of seaborne production) was slightly down by 2% but remains at a high level. In Gabon, production decreased by 29%, reflecting the decline in volumes at Comilog and other producers. In Australia, volumes normalised (x3.8 vs. Q3 2024), following the resumption of exports by a major producer.
Consequently, the global ore supply/demand balance remained in slight surplus for Q3 2025. Chinese port ore inventories therefore totalled 4.6 Mt at end-September (vs. 4.5 Mt at end-June 2025), equivalent to around 8 weeks of consumption.
The price index (CRU) for manganese ore (CIF China 44%) averaged $4.3/dmtu in Q3 2025, down 40% versus Q3 2024. This trend reflects unfavourable comparatives, given the very high price levels in July and August 2024 (averaging $8.4/dmtu).
The price index (CRU) for refined alloys in Europe (MC Ferromanganese) averaged €1,337/t in Q3 2025, down 21%, reflecting the impact of a decline in manganese ore prices and weaker demand over the period. The price index for standard alloys (Silicomanganese) was down by 16%.
Activities
In Gabon, production at the Moanda mine stood at 1.9 Mt in Q3 2025, down 8% over the quarter, to adjust the latter to transport capacity over the period. In parallel, transported ore volumes reached 1.6 Mt over the quarter (4.6 Mt over nine months), down 13%, penalised by operational issues on the Transgabonese railway line.
Rail transport remains the main pressure point in the logistics chain, highlighting the importance of the ongoing investment programme to renovate and modernise the Transgabonese railway.
Volumes of manganese ore sold externally amounted to 1.2 Mt over the quarter, up 8%, benefitting from favourable comparatives compared to Q3 2024, which was impacted by the closure of the high-grade ore market in China combined with increased volumes from South Africa.
FOB cash cost2 for manganese ore activity averaged $2.3/dmtu over the quarter, up 14% vs. Q3 2024, mainly reflecting the decrease in transported volumes as well as an unfavourable currency effect. Mining taxes and royalties came out to $0.2/dmtu, down in connection with the decrease in selling prices. Sea transport costs per tonne were also down 20%, to $0.9/dmtu, although freight rates currently remain high.
Manganese alloys production increased to 174 kt over the quarter (+5%), as did volumes sold, to 156 kt (+9%), with a less favourable mix which eroded the activity’s margin.
Outlook
Against the backdrop of a global slowdown in demand, global carbon steel production is expected to decline further in Q4 2025, falling by around 2% on a full-year basis.
The manganese ore market should remain in surplus in Q4, with ore supply stabilising and demand still subdued.
Market price consensus is currently set around $4.4/dmtu11 on average for Q4 2025; the current level of the CIF China 44% index is $4.3/dmtu.
Demand for manganese alloys should decline in Q4, in line with steel production and the Q3 build in inventory in China, while supply is expected to remain stable. However, product flows could continue to be disrupted by uncertainty surrounding trade measures (particularly in Europe and the United States).
Considering the persistent logistics challenges of the Gabonese rail transport, the target for transported manganese ore volumes is adjusted downwards to between 6.1 to 6.3 Mt (vs. 6.5 and 7.0 Mt disclosed at end-July). As a result, the targeted FOB3 cash cost is now expected to be between $2.3 and $2.4/dmtu (vs. $2.1 and $2.3/dmtu).
- Outlook
The global economy proved resilient to the trade tensions triggered by the United States, which mainly impacted the U.S. economy.
In China, activity showed signs of a slight slowdown in Q3, on the back of a strong first half. Declining investment in July and August suggests further stimulus measures may be necessary if the trend persists. The upcoming five-year plan should set out growth drivers and targets for the years ahead.
In Europe, industry remains in a difficult position, penalised by U.S. tariffs and fiercer competition from imports, despite several interest rate cuts.
This difficult macroeconomic environment should continue to weigh on demand and prices across all the Group’s markets until the end of the year.
The average price consensus27 and exchange rate28 for Q4 2025 currently stand at:
- c.$4.4/dmtu (i.e. c.$4.5/dmtu in 2025) for manganese ore (CIF China 44%),
- c.$15,400/t (i.e. c.$15,300/t in 2025) for LME nickel,
- c.$8,800/t-LCE (i.e. c.$9,100/t in 2025) for lithium carbonate (battery-grade, CIF Asia),
- 1.18 for the €/$ exchange rate (i.e. 1.13 in 2025).
Sensitivities of Adjusted EBITDA to the price of metals and to the exchange rate are presented in Appendix 5.
Following a tight supply of vessels, sea freight rates reached high levels in Q3. However, the outlook remains uncertain, particularly given the ongoing trade negotiations and geopolitical tensions in the Middle East. The cost of reductants and energy should rise by year-end.
- Guidance
Against this backdrop, 2025 volume and cash cost targets have been adjusted for manganese ore.
|
Activities |
Indicator |
2025 guidance (30/07/2025) |
2025 guidance (30/10/2025) |
|
Manganese ore |
Transported volumes |
6.5 - 7.0 Mt |
6.1 to 6.3 Mt |
|
FOB1,2 cash cost |
$2.1 - $2.3/dmtu |
$2.3 - $2.4/dmtu |
|
|
Nickel ore |
Volumes sold, o/w: |
39 - 42 Mwmt |
Confirmed |
|
Externally |
36 - 39 Mwmt |
Confirmed |
|
|
Internally |
3 Mwmt |
Confirmed |
|
|
Lithium carbonate |
Produced and sold volumes |
4 - 7 kt-LCE |
Confirmed |
|
Mineral Sands |
Produced volumes |
> 900 kt-HMC |
Confirmed |
1 Definitions in the financial glossary in Appendix 7.
2 For an exchange rate of $/€1.13 as of 30/07/2025 and as of 30/10/2025.
In addition, Capex4 is revised downwards and now expected to be between €400m and €425m in 2025.
|
Capex |
Activity |
2025 guidance (30/07/2025) |
2025 guidance (30/10/2025) |
|
Sustaining |
Group |
€150m - €200m |
€150m - €175m |
|
Growth |
Group, o/w: |
c.€250m |
Confirmed |
|
Manganese |
c.€130m |
c.€110m |
|
|
Mineral Sands |
c.€50m |
Confirmed |
|
|
Lithium |
c.€90m |
Confirmed |
Appendix 1: Reconciliation tables
|
Millions of euros |
9m 2025 |
9m 2024 |
Chg. (€m) |
Chg. (%) |
|
Turnover – published financial statements |
2,045 |
2,236 |
-191 |
-9% |
|
Share of PT WBN (38.7% - excluding off-take contract) |
244 |
247 |
-3 |
-1% |
|
Adjusted turnover |
2,289 |
2,483 |
-194 |
-8% |
|
Turnover excluded from SLN1 |
40 |
40 |
+0 |
+1% |
|
Adjusted turnover (excluding SLN)2 |
2,248 |
2,443 |
-195 |
-8% |
1 Turnover linked to the sale of nickel ore and others; turnover from the sale of SLN’s ferronickel which is booked under “Eramet S.A.”.
2 Definition in the financial glossary in Appendix 7.
Appendix 2: Quarterly turnover
|
Millions of euros1 |
Q3 |
Q2 |
Q1 |
Q4 |
Q3 |
Q2 |
Q1 |
|
Manganese |
421 |
492 |
457 |
460 |
569 |
548 |
448 |
|
Manganese ore activity2 |
221 |
275 |
250 |
224 |
338 |
308 |
254 |
|
Manganese alloys activity2 |
200 |
217 |
207 |
236 |
231 |
241 |
193 |
|
Adjusted Nickel (excluding SLN)2,3 |
142 |
117 |
114 |
287 |
64 |
147 |
138 |
|
Mineral Sands |
51 |
67 |
68 |
95 |
75 |
89 |
52 |
|
Lithium |
7 |
4 |
0 |
0 |
0 |
0 |
0 |
|
Holding, elim. and others4 |
98 |
105 |
104 |
93 |
96 |
113 |
105 |
|
Eramet group adjusted (excluding SLN)2,3 |
720 |
786 |
742 |
935 |
804 |
897 |
743 |
|
SLN turnover5 |
9 |
13 |
19 |
14 |
5 |
16 |
18 |
|
Eramet group published financial statements |
641 |
716 |
688 |
697 |
784 |
797 |
655 |
1 Data rounded to the nearest million.
2 See definition in the financial glossary in Appendix 7.
3 Adjusted turnover restated for 2024, following update of indicator definition.
4 Mainly includes turnover from the sale of SLN’s ferronickel since it is booked under “Eramet S.A.”; SLN’s turnover linked to the sale of nickel ore and others was excluded from the figures presented.
5 SLN’s turnover linked to the sale of nickel ore and others.
Appendix 3: Productions and shipments
|
Q3 2025 |
Q2 2025 |
Q1 |
Q4 |
Q3 |
Q2 |
Q1 |
9m 2025 |
9m 2024 |
|
|
Manganese |
|||||||||
|
Manganese ore and sinter production (Mt) |
1,874 |
1,764 |
1,785 |
1,237 |
2,045 |
1,595 |
1,926 |
5,423 |
5,566 |
|
Manganese ore and sinter transportation (Mt) |
1,586 |
1,659 |
1,386 |
1,099 |
1,819 |
1,559 |
1,638 |
4,631 |
5,016 |
|
External manganese ore sales (Mt) |
1,245 |
1,432 |
1,240 |
1,418 |
1,152 |
1,445 |
1,466 |
3,917 |
4,063 |
|
Manganese alloys production (kt) |
174 |
160 |
162 |
145 |
166 |
170 |
154 |
496 |
490 |
|
Manganese alloys sales (kt) |
156 |
161 |
149 |
167 |
143 |
173 |
149 |
465 |
465 |
|
Nickel |
|||||||||
|
Marketable nickel ore production – PT WBN (100% basis – kwmt)1 |
12,323 |
7,080 |
9,169 |
13,886 |
1,441 |
7,820 |
8,885 |
28,572 |
18,146 |
|
Nickel ore external sales – PT WBN (100% basis – kwmt) |
9,271 |
5,639 |
5,399 |
16,843 |
1,390 |
5,982 |
6,079 |
20,309 |
13,451 |
|
o/w Saprolite – (kwmt) |
6,243 |
4,574 |
3,757 |
16,393 |
1,390 |
5,236 |
5,479 |
14,574 |
12,105 |
|
o/w Limonite – (kwmt) |
3,028 |
1,065 |
1,642 |
450 |
0 |
746 |
600 |
5,734 |
1,346 |
|
Nickel ferroalloys production – PT WBN (100% basis – kt-Ni content) |
9.4 |
7.9 |
9.1 |
9.1 |
7.4 |
6.6 |
7.4 |
26.4 |
21.4 |
|
Nickel ferroalloys sales (NPI) – PT WBN – Eramet offtake 43% (kt-Ni content) |
4.1 |
3.5 |
3.9 |
3.2 |
3.4 |
2.9 |
2.8 |
11.4 |
9.2 |
|
Mineral Sands |
|||||||||
|
Mineral Sands production (kt) |
239 |
253 |
236 |
226 |
250 |
215 |
192 |
729 |
657 |
|
Ilmenite production (kt) |
145 |
174 |
130 |
172 |
144 |
138 |
116 |
449 |
398 |
|
Zircon production (kt) |
17 |
19 |
16 |
19 |
17 |
18 |
14 |
52 |
49 |
|
Ilmenite sales (kt) |
115 |
166 |
126 |
195 |
125 |
166 |
75 |
407 |
366 |
|
Zircon sales (kt) |
17 |
16 |
17 |
22 |
15 |
16 |
13 |
50 |
44 |
|
Lithium |
|||||||||
|
Lithium carbonate production |
2,080 |
270 |
440 |
0 |
0 |
0 |
0 |
2,790 |
0 |
|
Lithium carbonate sales |
1,000 |
480 |
40 |
0 |
0 |
0 |
0 |
1,520 |
0 |
1 With the approval of a new feasibility study (long-term mining plan) during summer 2024, certain nickel-poor ores, which were considered as waste rock and not recognised in official ore production, are now classified as ores and recorded in production.
Appendix 4: Price and index
|
|
9m 2025 |
Q3 |
H1 |
9m |
Q3 |
H1 |
Chg. Q3 2025 – Q3 2024 |
Chg. 9m 2025 – 9m 2024 |
|
Manganese |
|
|
|
|
|
|
|
|
|
Mn CIF China 44% ($/dmtu)1 |
4.54 |
4.34 |
4.64 |
6.01 |
7.27 |
5.38 |
-40% |
-24% |
|
Ferromanganese MC – Europe (€/t)1 |
1,419 |
1,337 |
1,460 |
1,580 |
1,695 |
1,523 |
-21% |
-10% |
|
Silicomanganese – Europe (€/t)1 |
1,061 |
1,027 |
1,078 |
1,189 |
1,225 |
1,171 |
-16% |
-11% |
|
Nickel |
|
|
|
|
|
|
|
|
|
Ni LME ($/t)2 |
15,252 |
15,011 |
15,372 |
17,089 |
16,255 |
17,506 |
-8% |
-11% |
|
Ni LME ($/lb)2 |
6.92 |
6.81 |
6.97 |
7.75 |
7.37 |
7.94 |
-8% |
-11% |
|
SMM NPI Index ($/t)3 |
11,757 |
11,520 |
11,876 |
12,008 |
12,309 |
11,858 |
-6% |
-2% |
|
HPM4 Nickel prices 1.6%/35% ($/wmt) |
27 |
26 |
27 |
30 |
30 |
30 |
-13% |
-11% |
|
HPM4 Nickel prices 1.8%/35% ($/wmt) |
34 |
33 |
34 |
38 |
38 |
38 |
-13% |
-11% |
|
Mineral Sands |
|
|
|
|
|
|
|
|
|
Zircon ($/t)5 |
1,723 |
1,630 |
1,770 |
1,907 |
1,890 |
1,915 |
-14% |
-10% |
|
Chloride ilmenite ($/t)6 |
278 |
270 |
283 |
300 |
300 |
300 |
-10% |
-7% |
|
Lithium |
|
|
|
|
|
|
|
|
|
Lithium carbonate, battery-grade, CIF China excl. VAT ($/t LCE)7 |
8,795 |
9,048 |
8,657 |
11,880 |
9,945 |
12,929 |
-9% |
-26% |
|
Exchange rate |
|
|
|
|
|
|
|
|
|
EUR/USD ($/€)8 |
1.12 |
1.17 |
1.09 |
1.09 |
1.10 |
1.08 |
+6% |
+3% |
1 Quarterly average market prices (based on monthly Index CRU prices), Eramet calculation and analysis.
2 LME (London Metal Exchange) prices.
3 SMM NPI 8-12%.
4 Official index for domestic nickel ore prices in Indonesia.
5 Market and Eramet analysis (premium zircon).
6 Market and Eramet analysis.
7 SMM (Shanghai Metals Market): Lithium carbonate battery-grade CIF China spot price, excl. VAT.
8 Bloomberg.
Price floor (HPM) = HMA x Nickel ore grade (%Ni) x Correction factor x [1 – nickel ore moisture (%H2O)] in $/wmt
- HPM: nickel ore price floor, derived from “Harga Patokan Mineral” in Indonesian
- HMA: nickel ore reference price, derived from “Harga Mineral Acuan” in Indonesian, which is equivalent to the average LME cash nickel price between the 20th month-2 and the 19th month-1, expressed in $/nickel tonnes
N.B.: the reference period was changed starting in March 2025, and corresponds to the average LME cash nickel price between the 5th and 25th month-1
- Correction factor = 20% - 1% x [(1.9% - Nickel ore grade (%Ni)) x 100]
Appendix 5: Sensitivities of Group adjusted EBITDA
|
Sensitivities |
Change |
Adjusted EBITDA impact |
|
Manganese ore prices |
+$1/dmtu |
c.€215m1 |
|
Manganese alloys prices |
+$100/t |
c.€60m1 |
|
Nickel ore prices (HPM Nickel) – Weda Bay |
+$10/wmt |
c.€125m1 |
|
Lithium prices (lithium carbonate, battery-grade, CIF Asia) |
+$1,000/t-LCE |
c.€5m1 |
|
Exchange rate |
-$/€0.1 |
c.€125m |
1 For an exchange rate of $/€1.13.
Appendix 6: Société Le Nickel (SLN)
|
|
Q3 |
Q2 |
Q1 |
Q4 |
Q3 |
Q2 |
Q1 |
9m |
9m |
|
Nickel ore production – (kwmt) |
809 |
694 |
700 |
812 |
695 |
389 |
1,014 |
2,203 |
2,098 |
|
Nickel ore external sales – (kwmt) |
116 |
169 |
230 |
144 |
60 |
196 |
247 |
514 |
503 |
|
Ferronickel production – (kt-Ni content) |
9.2 |
8.8 |
8.7 |
7.7 |
7.8 |
8.3 |
9.1 |
26.7 |
25.2 |
|
Ferronickel sales – (kt-Ni content) |
8.9 |
9.3 |
8.2 |
7.8 |
7.7 |
8.7 |
8.7 |
26.4 |
25.1 |
|
Ni ore CIF China 1.8% ($/wmt)1 |
79.7 |
81.3 |
75 |
75.1 |
74.7 |
71.5 |
69.4 |
78.7 |
71.9 |
In New Caledonia, SLN’s mining production amounted to 809 kwmt in Q3 2025, up 15% versus Q3 2024. It remains heavily impacted by the closure of certain mining sites following the riots of H1 2024.
SLN’s nickel ore exports also remained constrained in Q3 2025, at 116 kwmt.
In Q3 2025, nickel ore prices (1.8% CIF China), as exported by SLN, averaged $80/wmt, increasing by 7% from Q3 2024.
Ferronickel production totalled 9.2 kt-Ni, up 18% year-on-year, albeit still limited. Volumes sold stood at 8.9 kt-Ni (+15% vs. Q3 2024).
Cash cost6 of ferronickel production averaged $8.4/lb over the period, down from the same period in 2024 ($8.7/lb). This improvement is mainly due to a favourable volume effect and lower energy costs, which were partly offset by an unfavourable currency effect.
The spot price of ferronickel as produced by SLN (also class II nickel) was set above prices for NPI.
- [Editor:tianyawei]
 Daily News
 Research
 Magazine
 Company Database
 Customized Database
 Conferences
 Advertisement
 Trade
Trade


 Online inquiry
 Contact


Tell Us What You Think